(This one's feeling a little cramped on smaller screens.)
Please switch to a larger screen to view this case study.
A ledger that showed everything, but explained nothing.

TravelTriangle · B2B2C · AGNET Platform
A ledger that showed everything, but explained nothing.
Context
About
Product: Travel Agent Product, TravelTriangle
Role: Lead Product Designer
TravelTriangle connects travellers and agents with the brand’s holiday products through a three-sided marketplace for customised holidays.
The Challenge
The unresolved issues on the dashboard became bottleneck to growth
Partners Are Resisting Adoption
Productivity Is Declining
Customers Are Losing Trust
Legal Liability Is Increasing
Revenue Is Leaking
Impact
~50%
Reduction in complaint tickets reducing the overhead for Agent Handlers and the Finance team.
Reduction in complaint tickets
10-12x
Improvement in productivity directly impacts revenue.
Improvement in productivity
Situation
The Voucher & Payment Module
It takes an agent 4–6 min/trip to review and ensure the updates are clear and business is on track.
With hundreds of active accounts, each lasting 6–8 weeks, agents had to spend significant time manually tallying their ledgers.
It takes an agent 4–6 min/trip to review and ensure the updates are clear and business is on track.
With hundreds of active accounts, each lasting 6–8 weeks, agents had to spend significant time manually tallying their ledgers.
As the product started to scale
Complaint tickets surged
Settlements were delayed
Agents bypassed the product for transactions with customers.


Core Issues Identified As
Everything was documented, but nothing was communicated
Inaccurate Information.
Missing Information.
Improper Representation.
Other Issues.
Solution
The Redesign
Progressive Disclosure:
Reduced cognitive load and helped agents make quick macro decisions.Colour Coding & Storytelling
Used colour as visual cues for faster scanning and comprehension.
Trained on a guided narrative to make the experience easier to adopt.
Leveraged Existing Behaviours & Language
Simplified the visual hierarchy for faster comprehension.
Used familiar microcopy rooted in users’ existing language and habits.
On average, the earlier design processed about 10 trips per hour.
With the new design, that same hour now handles 80 to100 trips, with 50% less complaints tickets.
(The collapsed card, summary view)

(The expanded card, detailed view)


Approach
Designed to be skimmed first, read next.
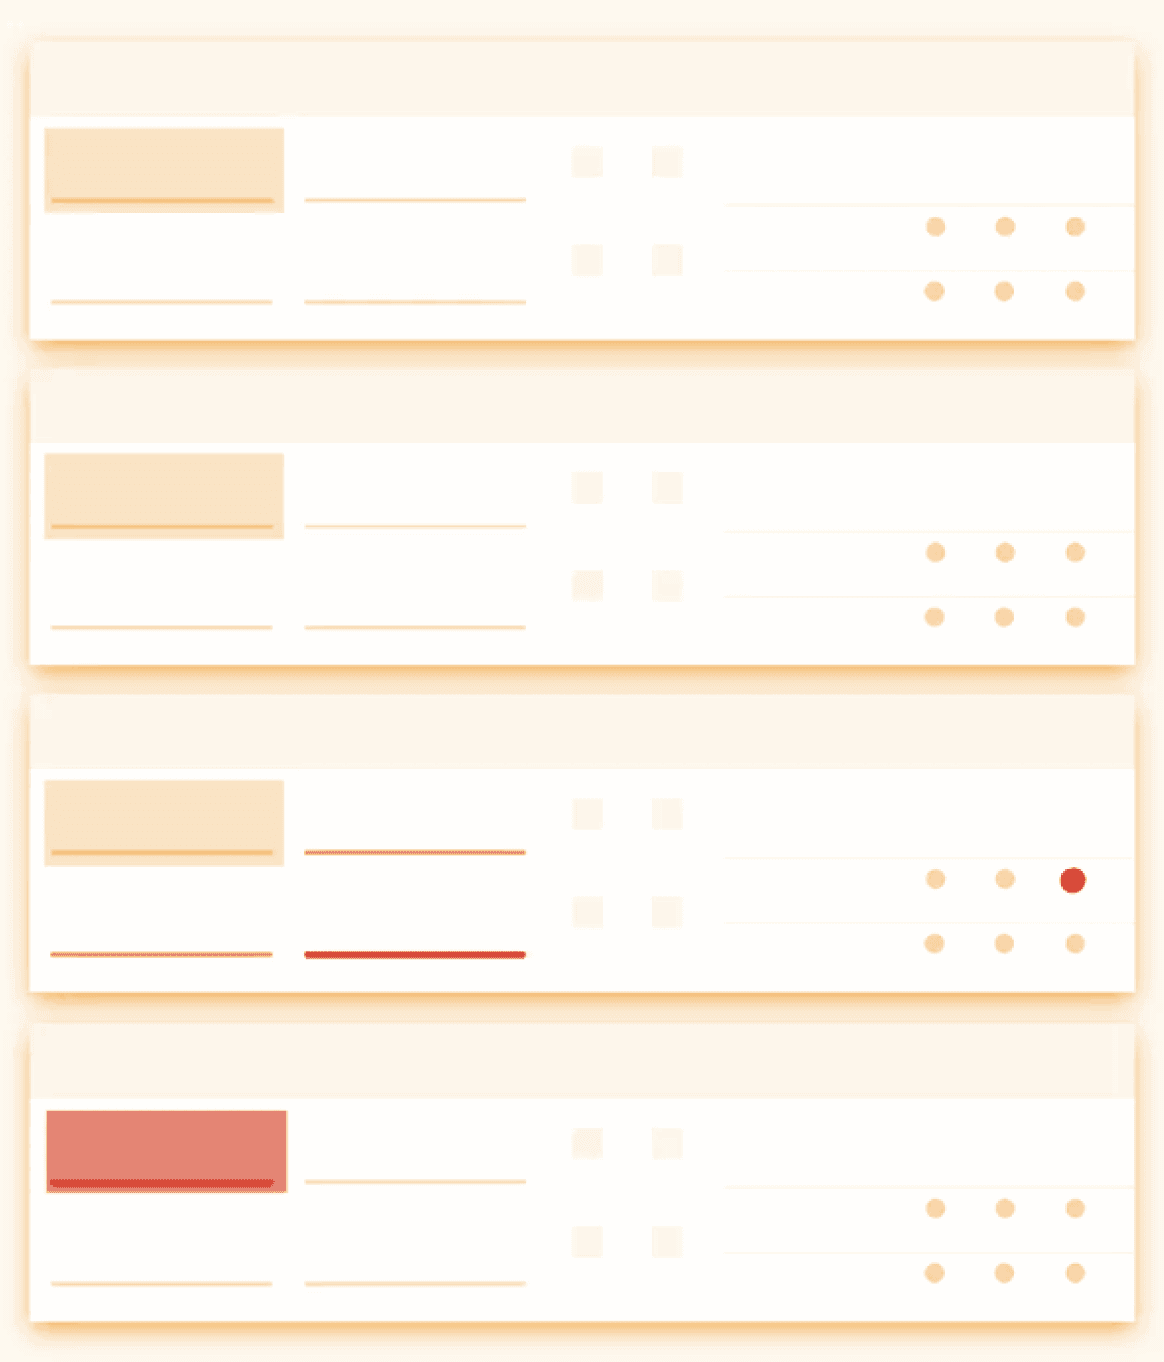
The Ideal State · Job well done
₹0 in the box, with no red highlights.
In Progress · No Action Required
Amount above ₹0, with no red highlights. Payments are still in process.
Alert · Action Required
Amount above ₹0, with red highlights. Money is blocked. Check the details.Critical · At Risk
The box is red with a negative amount. You’ve received more than you're due and now owe TravelTriangle.
Progressive Disclosure: level 1 (Summary View)
Primary User:Agent-side account owner, responsible for reconciling transactions with TT.
Goal: Ensure all dues are collected, balances are clear, and records match agreed terms.
The Card Structure
Showed only the critical information and signals needed to keep the active trip on track.
New icons introduced to reduce anxiety of ‘where the money is gone’
Unclear payment recovery: Previous-trip recoveries deducted from a subsequent trip lacked visibility.
Hidden payment terms: Agents couldn’t see their payment terms, creating expectation mismatches and anxiety around holds.
Inconsistent terms: Destination-specific terms, especially domestic vs. international, made standardising payment rules difficult.
Unused discount delight: Discounts were a positive moment that wasn’t being leveraged.


Progressive Disclosure: level 2 (Expanded View)
At the 2nd level, in the fully open card view, the information unfolds more smoothly and progressively.
The modules inside are placed in the natural order of reading from B to F.
Some Nuances of Problem Solving
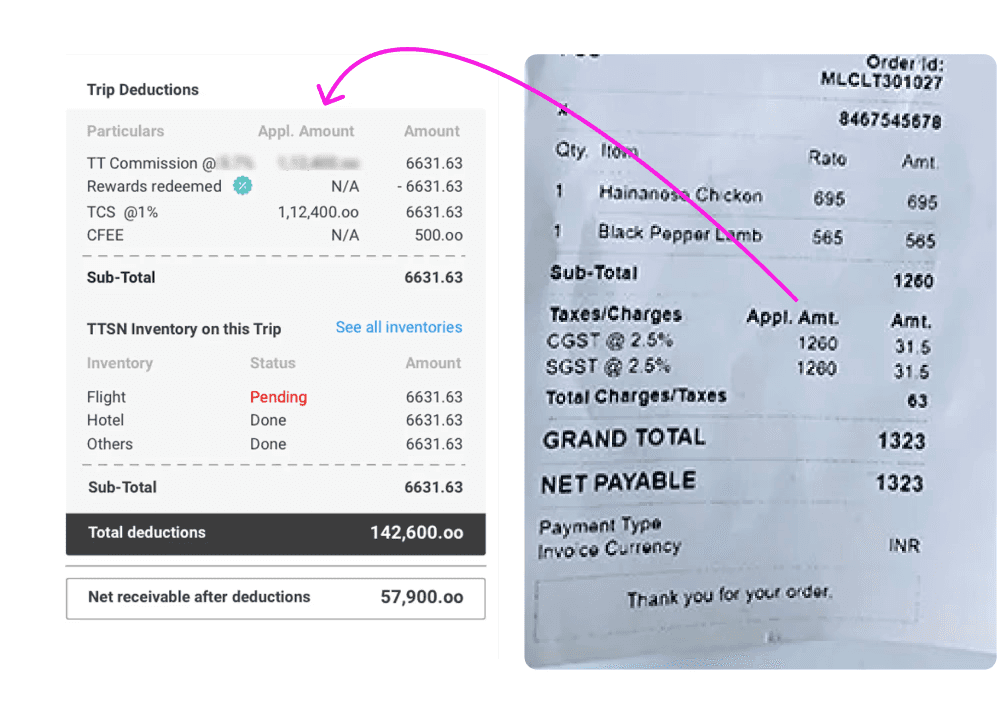


A Functional Proof of Concept:
The entire module was simulated in Excel using dozens of real trip datasets, uncovering edge cases early and making QA far more predictable.
Annexure
Stakeholders involved

It is a 3-way payment transactions between Travel agents, Travelers, and Finance team.

Complaint Analysis
As reported by internal stakeholders
Empty & Insignificant Payment Tranches.
System auto-posts identical amounts in positive and negative tranches.
Unclear SLA after Voucher Upload.
Unclear why payment is not received.
AH/Agent is unaware of the payment hold.
Payment adjustments are listed without context.
Every fix happened outside the product.
The finance team manually carried the workload the dashboard should have.
Complaint Ticket Analysis
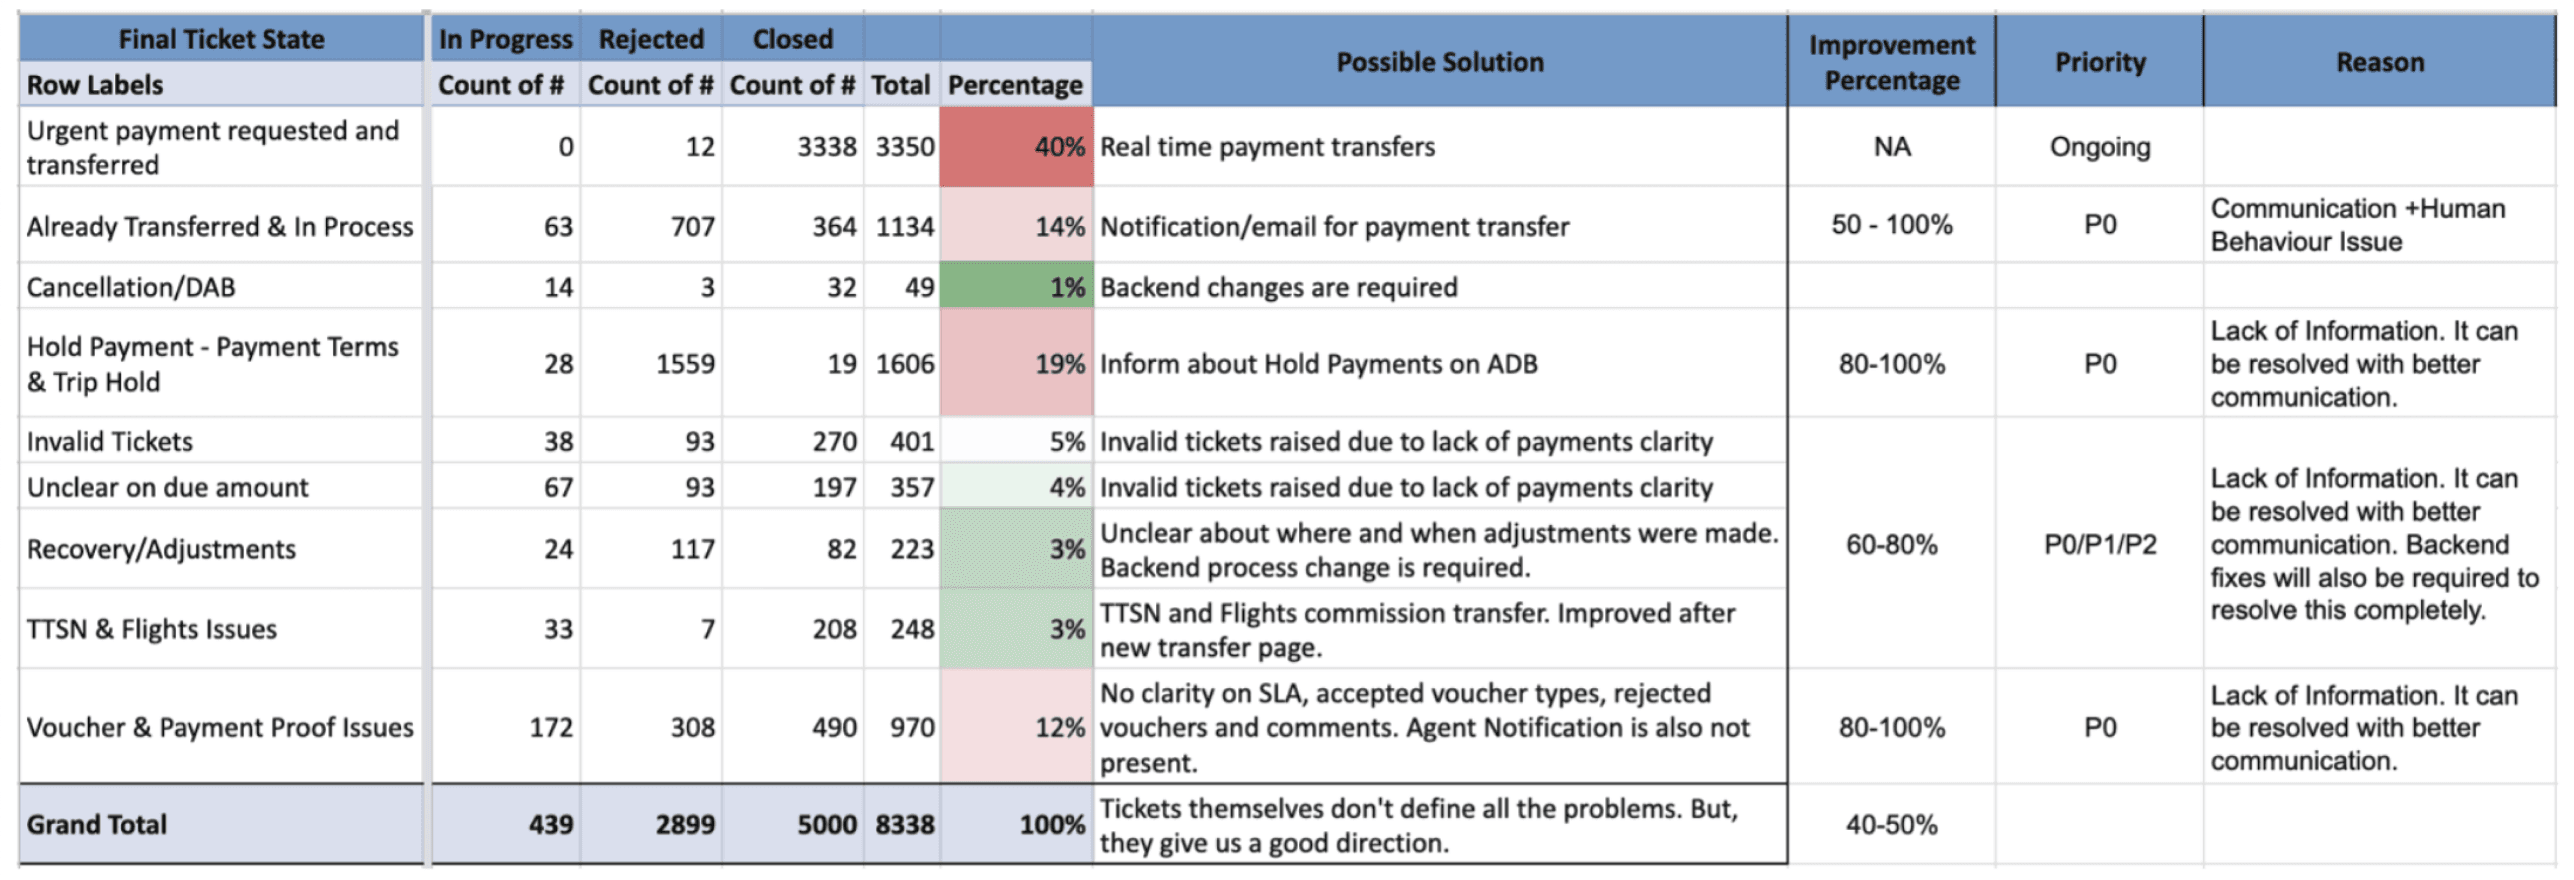
Understanding the rejection reasons and gaps in the process design.

A missing field, the rejection reason, in the dashboard created a cascade of issues that didn't actually exist. The absence of data became its own kind of noise.

21.30 % of these issues could be resolved under the current scope at 50% confidence level.
Assumption:
Agent uploads payment proof and waits until the next day. If the payment doesn't hit their account, they call AH to find out. We can reduce this cycle by instantly displaying the rejection and reducing the rejection rate.
Survey’s conducted for understanding the following.
Agents internal process.
Finance person background.
Accounting process.
Post sales payment process knowledge (uploading vouchers/payment proofs).
Payment process knowledge.


This project used data to find the solution, storytelling to make it understood, and visual design to make the experience feel effortless.